Smart Haul and Insight Dashboard
|
Smart Haul and Insight Dashboard
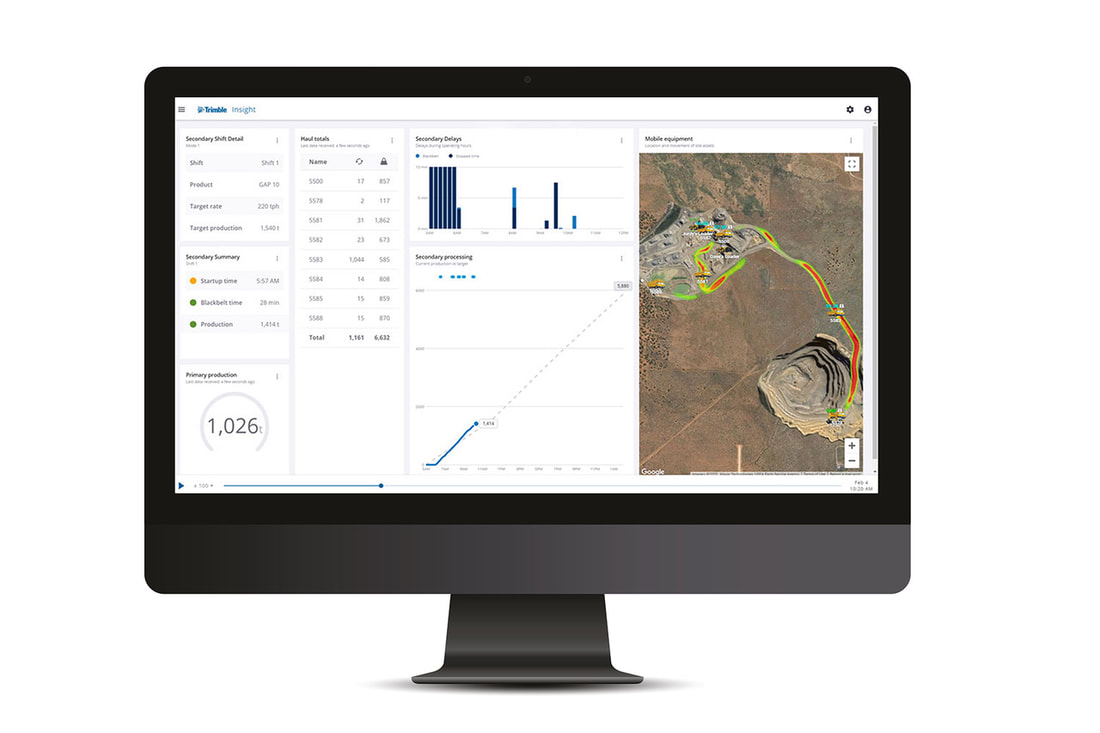
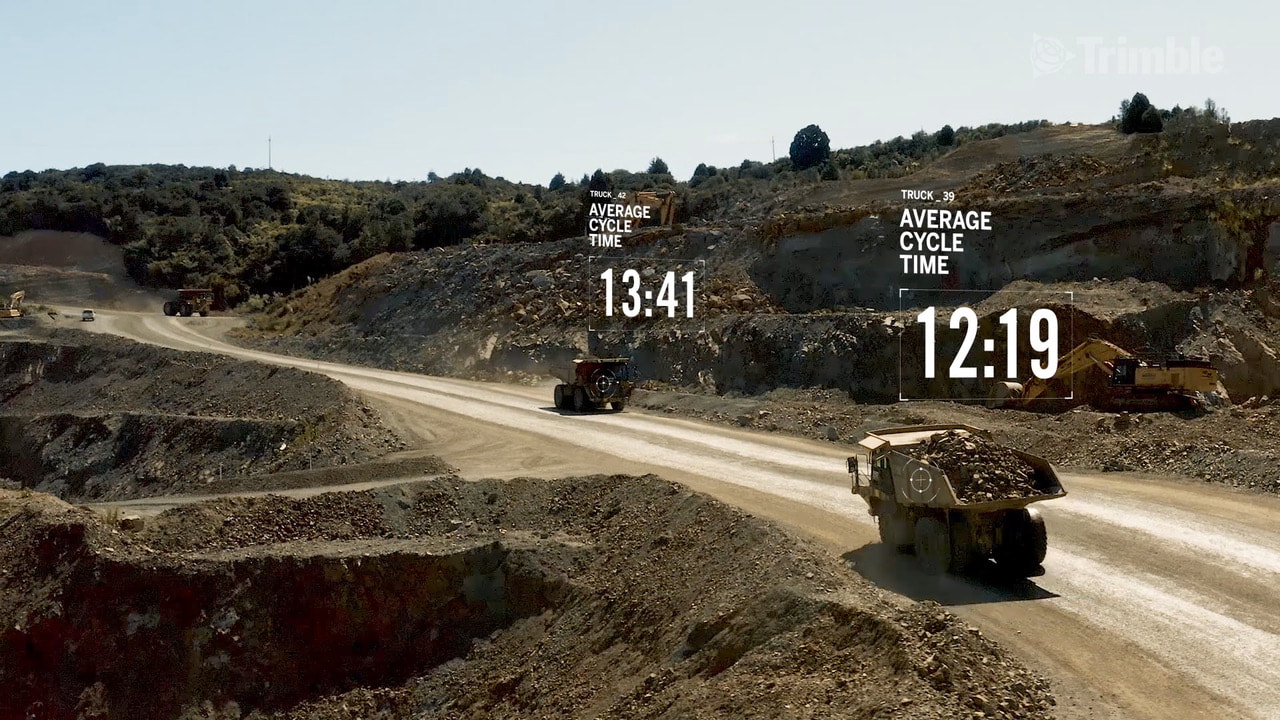
See all of your load and haul productivity data at a glance. Compare operators and check that your haul fleet is meeting plant demand, adjusting to changes in cycle time or that product ratios are meeting targets. Loading efficiency data with an average load and hauling time is also available to view. Aggregates production data is often late, unreliable or requires a manual process to gather. This makes it difficult for quarry managers, fleet managers and plant managers to positively influence production with informed decisions during the shift. Dashboards All your production metrics (load/haul, processing and products) from your excavators, haul trucks, ADTs, conveyors, and loaders KPI Summary Summarise KPIs and metrics to identify lost productivity (late starts, blackbelt time) Real-Time Production Data Compare haul targets for each shift/plant mode and monitor near real-time performance. Customisable views Insight draws data from LOADRITE loader, excavator, haul truck and conveyor belt scales into centralised cloud storage. Using administrator customisation for machine names, geofenced load/dump and stockpile locations, Insight calculates production metrics and predicts any trends for the user. |
|


